Compute Multi-trait GWAS with JASS
Once the GWAS summary statistics are integrated in the inittable, you can generate analysis for any combination and several joint tests with the command jass create-project-data (see command line usage for the detail of arguments).
Whatever the test used, the command will generate three output:
A HDFStore containing several tables (Each table can be read from the HDFStore with the pandas.read_hdf function): - 'SumStatTab' : The results of the joint analysis by SNPs - 'PhenoList' : the meta data of analysed GWAS - 'COV' : The H0 covariance used to perform joint analysis - 'GENCOV' (If present in the initTable): The genetic covariance as computed by the LDscore. - 'Regions' : Results of the joint analysis summarised by LD regions (Notably Lead SNPs by regions) - 'summaryTable': a double entry table summarizing the number of significant regions by test (univariate vs joint test)
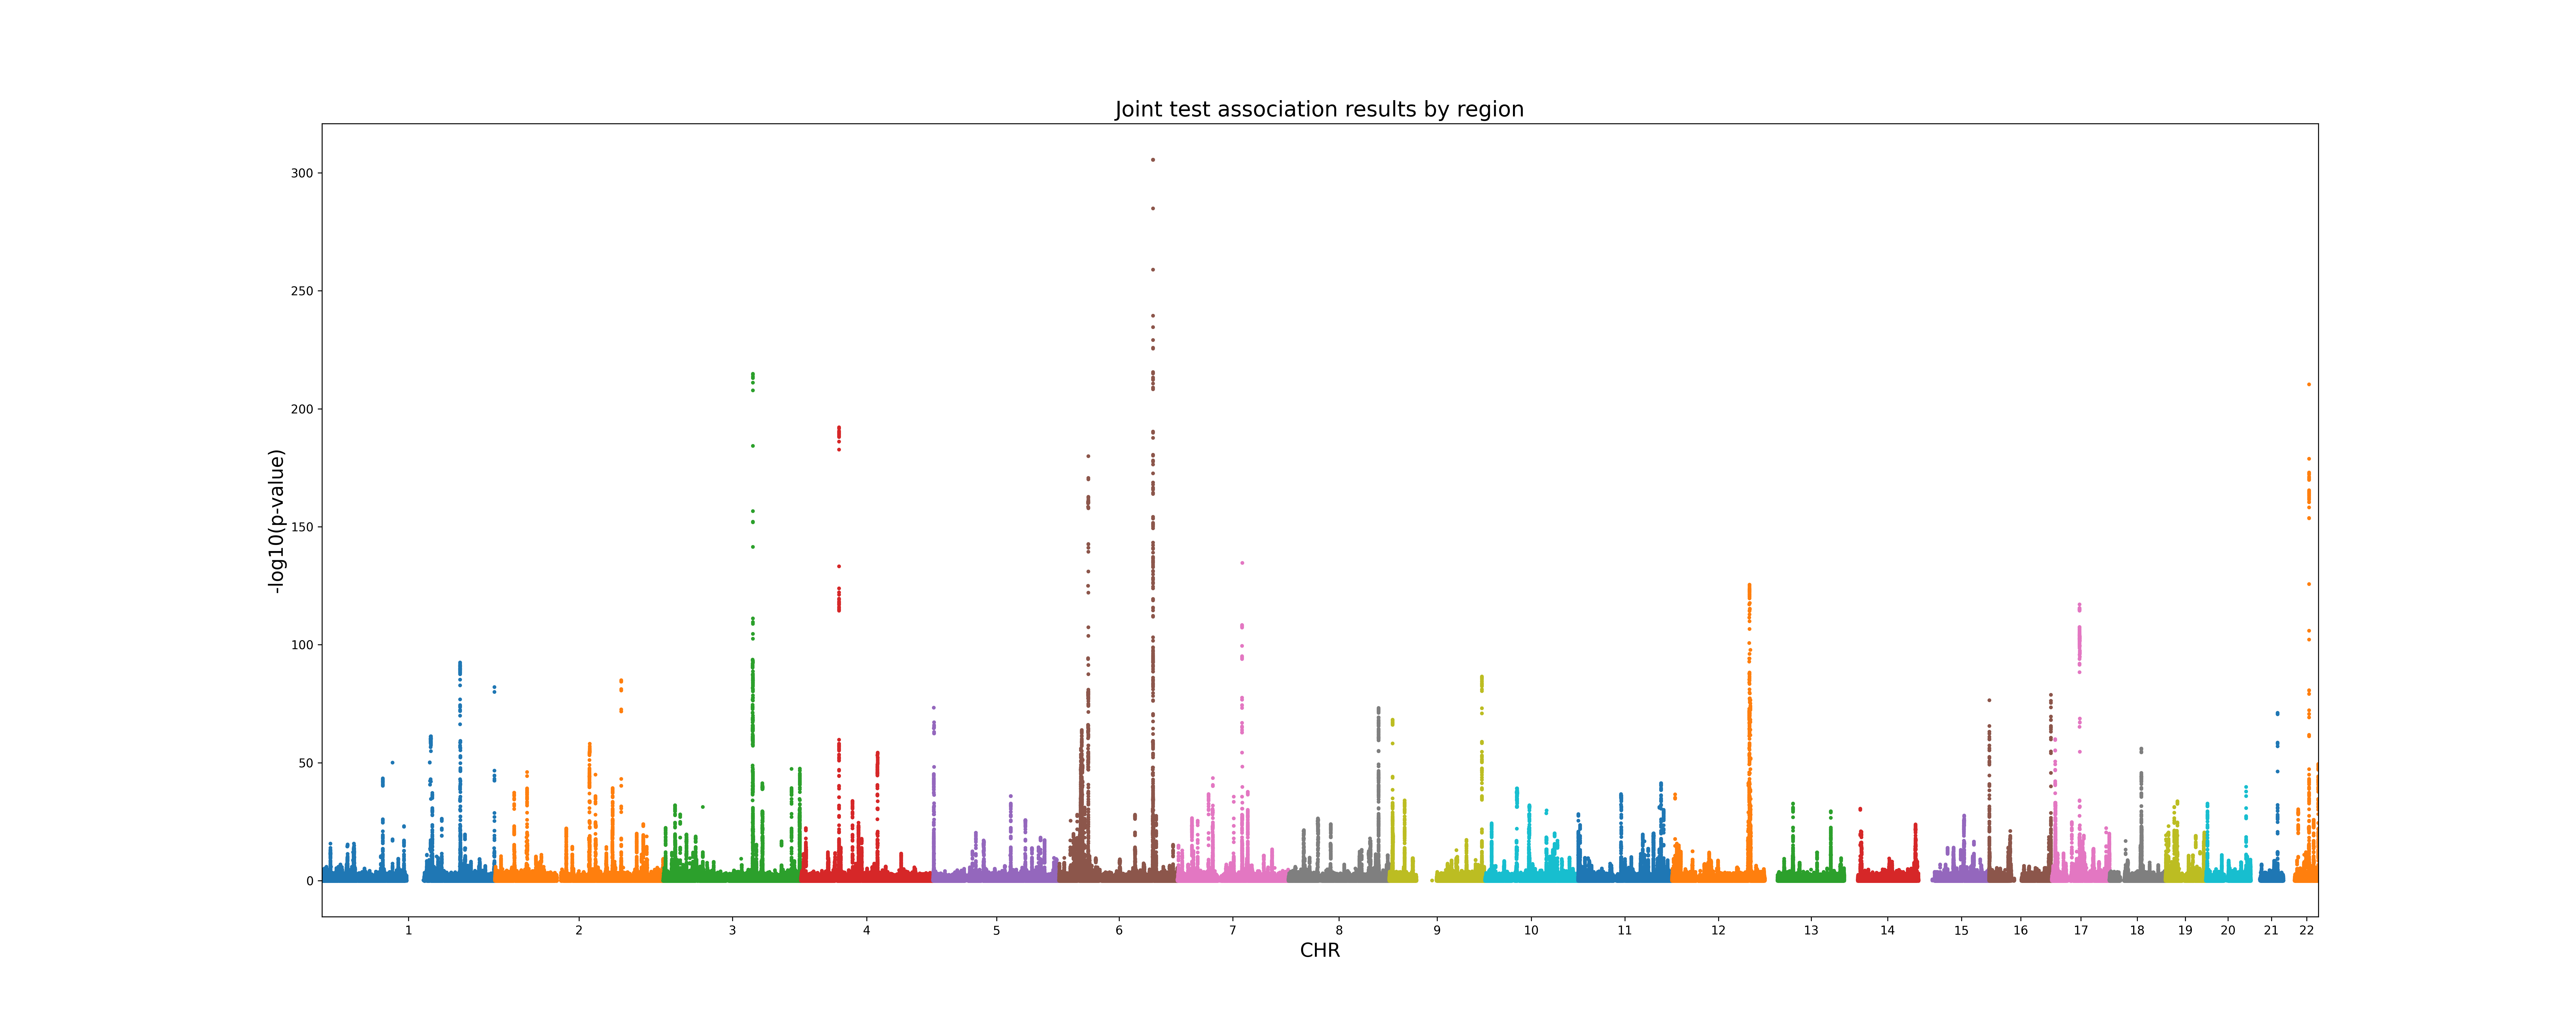
A .png Manhattan plot of the joint test p-values:

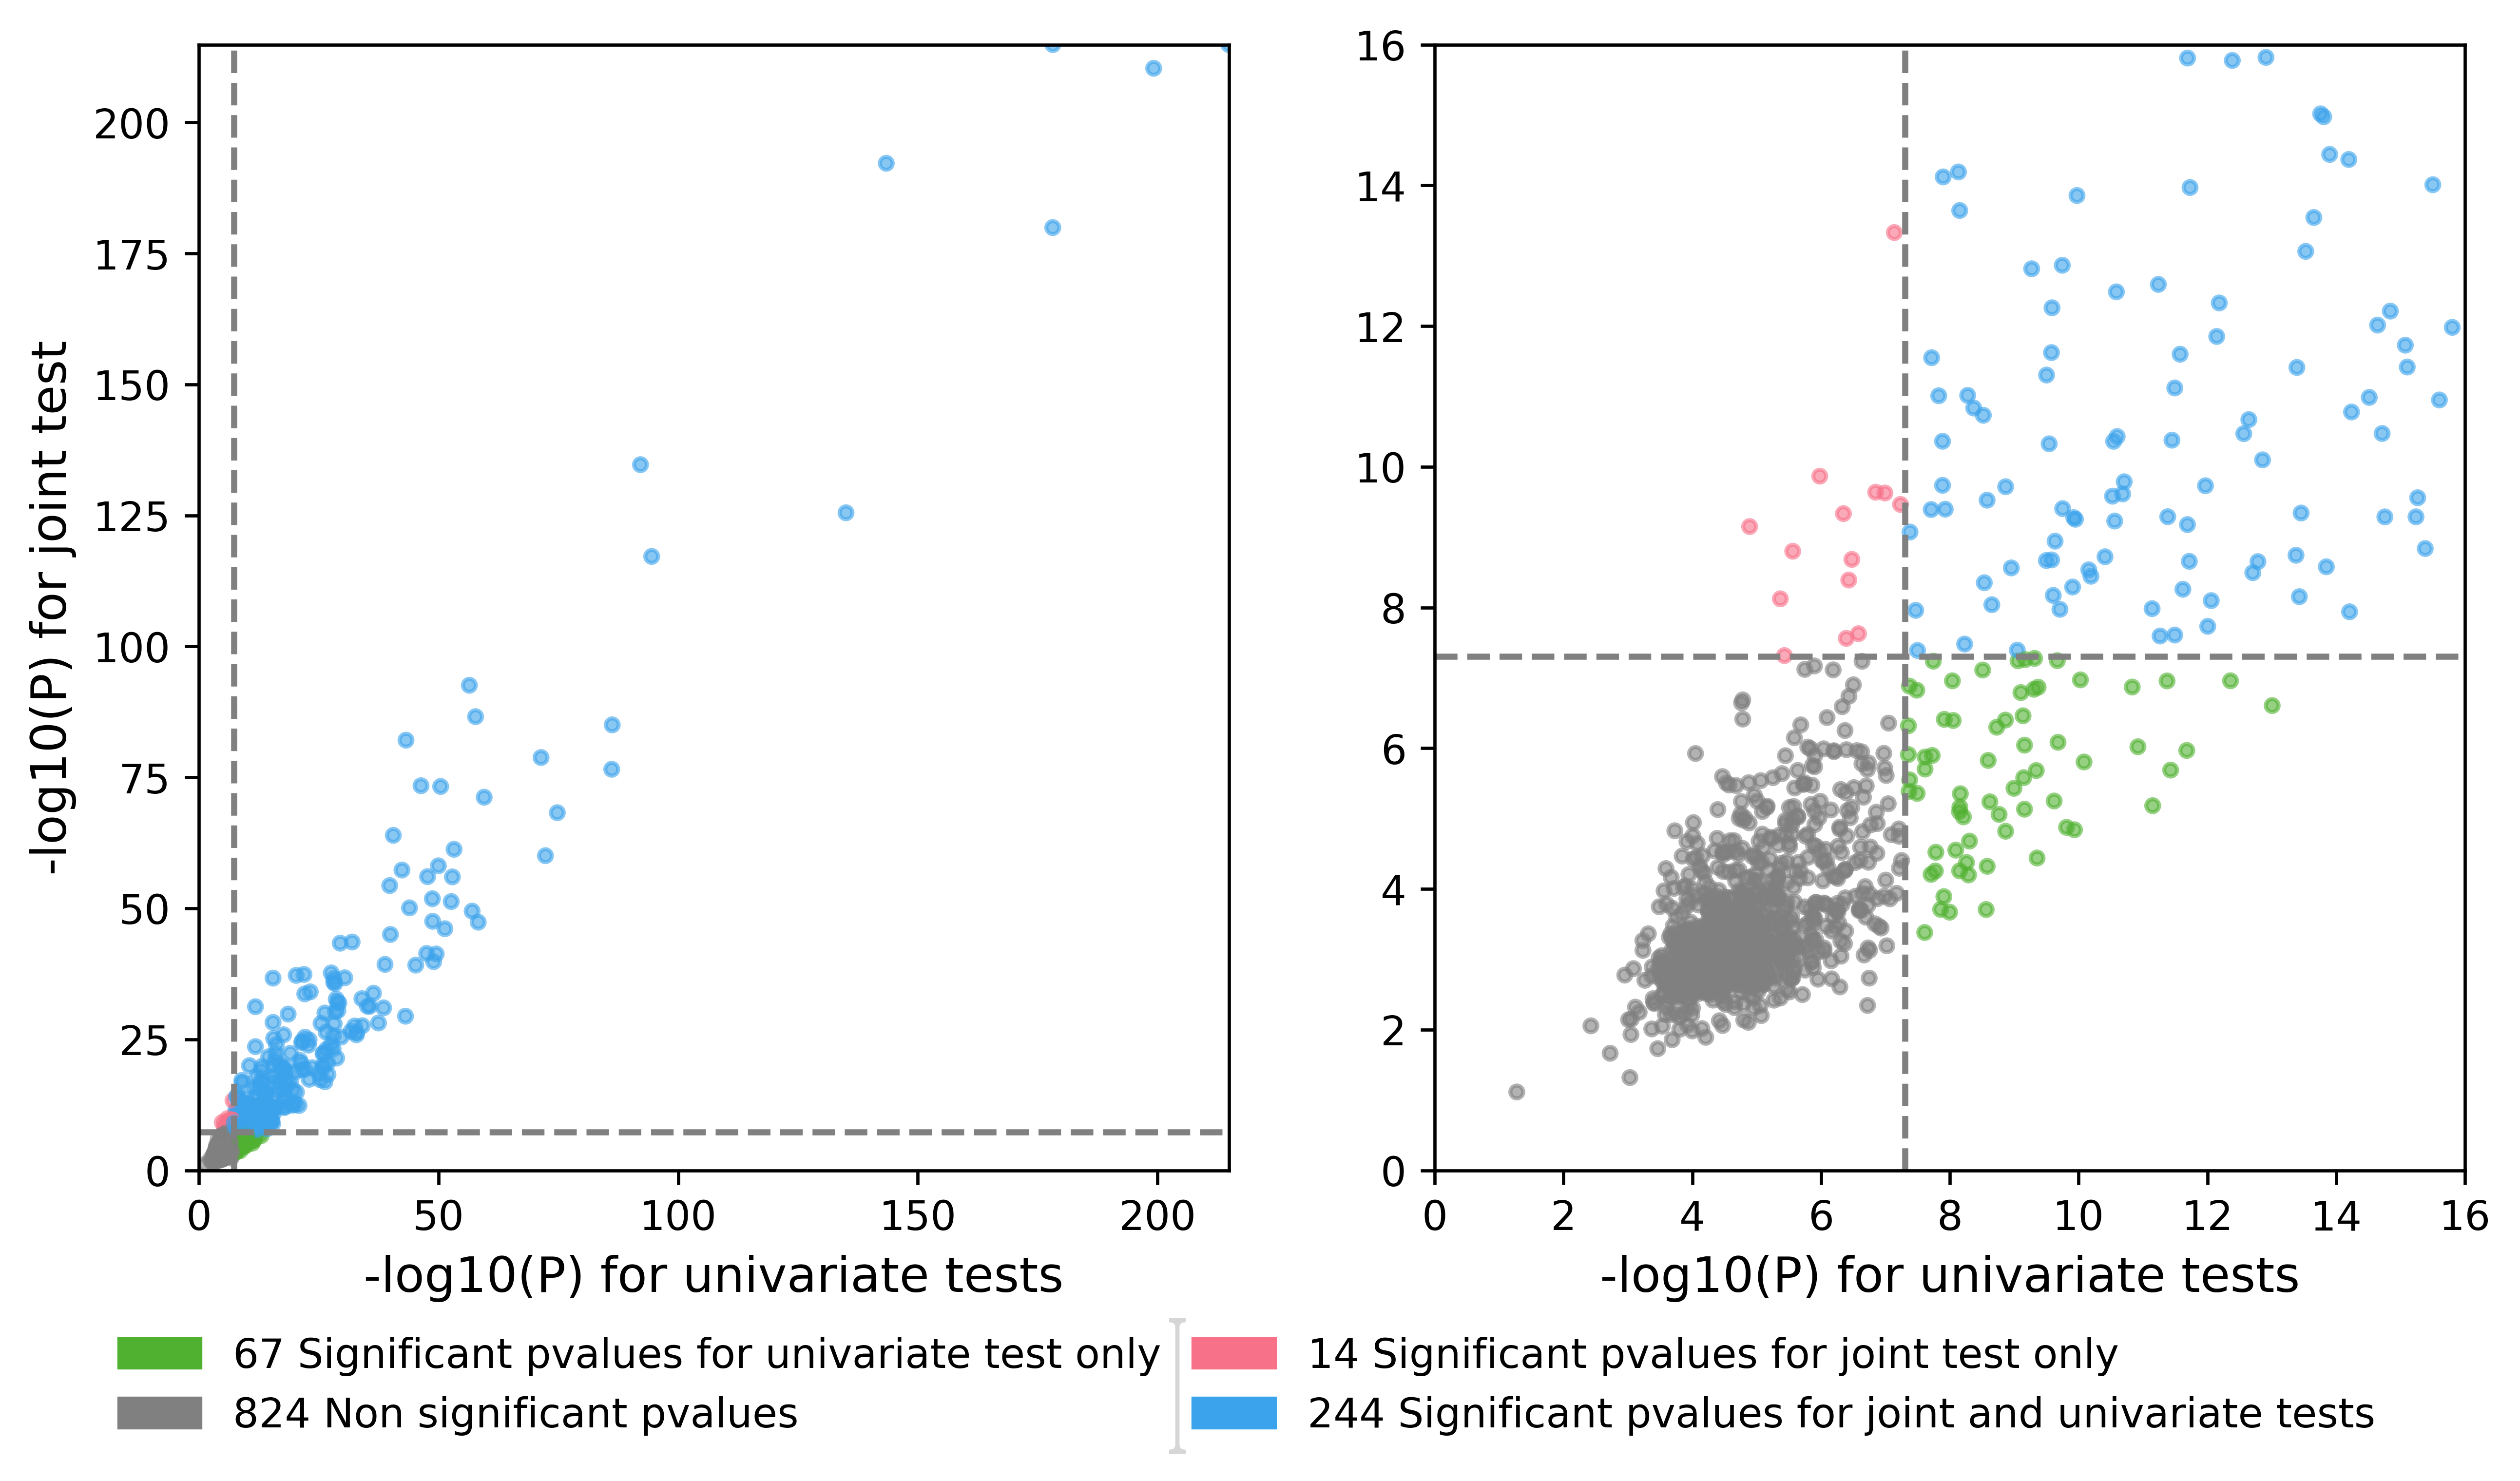
A .png Quadrant plot which is a scatter plot of the minimum p-value by region of the joint test with respect to the minimum p-value by region of the univariate tests. This plot provides an easy way to see if your joint analysis detected association not previously reported in the litterature.

The Omnibus tests
If no method option, a Omnibus test analysis will be performed.
The SumZ test
If the flag --sumz is passed to the jass create-project-data a SumZ test will be performed. By default, all the traits will have the same weight.
If the user wishes to, she/he can specify a vector of weight by using the --custom-loadings option.
jass create-project-data --init-table-path inittable_Update_COVID19.hdf5 --phenotypes z_INFECTION_INFLUENZA z_INFECTION_EAR-INFECTIONS --worktable-path worktable_test_SumZ.hdf5 --manhattan-plot-path manhattan_SumZ_test.png --quadrant-plot-path quadrant_SumZ_test.png --qq-plot-path QQplots_SumZ_test.png --sumz --custom-loadings test_loadings.csv"
the test_loadings.csv is comma separated file with the following structure:
trait |
weight |
|---|---|
z_INFECTION_INFLUENZA |
0.8 |
z_INFECTION_EAR-INFECTIONS |
-0.2 |
Access HDFStore components
Each table of the HDFStore is accessible through the command line tool jass extract-tsv (see command line reference for complete details).
jass extract-tsv --hdf5-table-path ./initTable.hdf5 --tsv-path './test_extract.tsv' --table-key SumStatTab
Alternately, you can use directly pandas read_hdf functions :
For instance if you want to access the Regions table :
pd.read_hdf("WK_test.hdf5", "Regions")
Note that is you wish that the SumStatTab table to be saved as a csv file you can provide the command lines with the --csv-file-path option and a csv will be generated as well. Outputting a csv while lengthen execution and require the appropriate storage space.
Command Line example
See command line usage for details .. code-block:: shell
jass create-project-data --init-table-path init_table/init_table_EUR_not_imputed.hdf5 --phenotype z_MAGIC_GLUCOSE-TOLERANCE z_MAGIC_FAST-GLUCOSE z_MAGIC_FAST-INSULIN z_MAGIC_HBA1C --worktable-path ./work_glycemic.hdf5 --manhattan-plot-path ./manhattan_glycemic.png --quadrant-plot-path ./quadrant_glycemic.png